Track Record
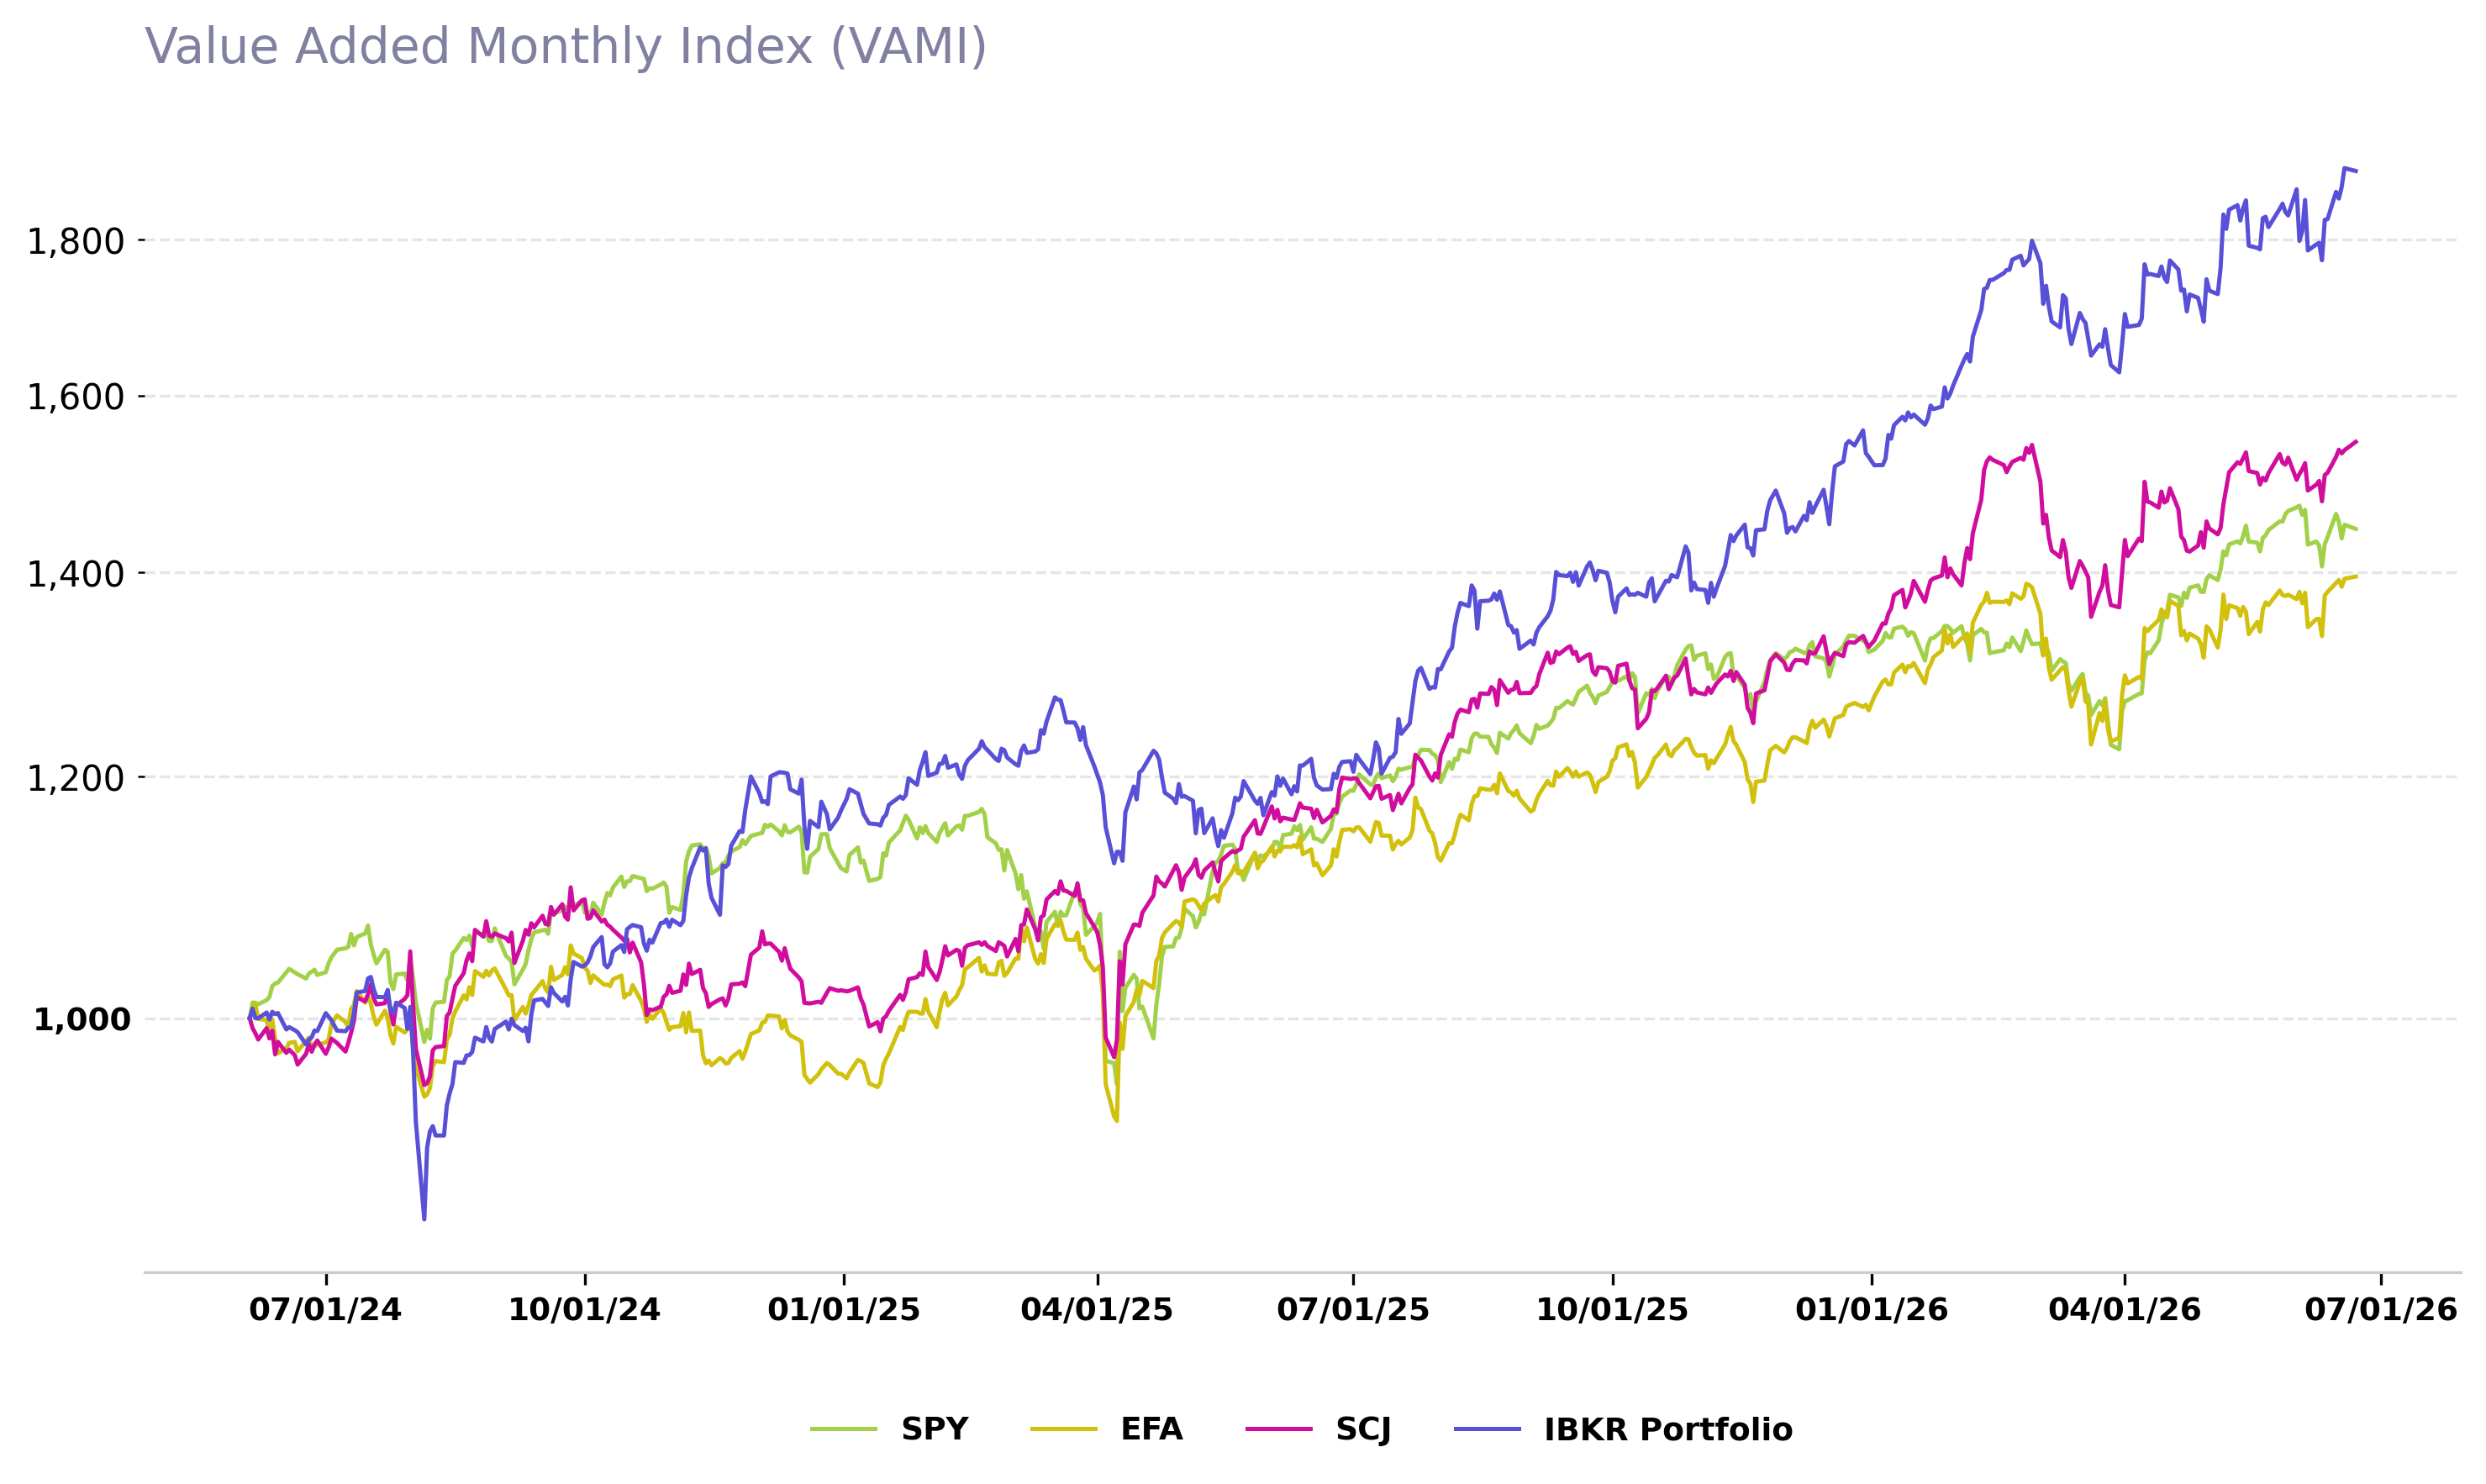
Current Drawdown -7.09%
Peak Aug 7, 2026 · Returns through Sep 24, 2026
Calendar Returns
Compounded daily returns through September 24, 2026
| Year | Monthly | Quarterly | Annual | ||||||||||||||
|---|---|---|---|---|---|---|---|---|---|---|---|---|---|---|---|---|---|
| Jan | Feb | Mar | Apr | May | Jun | Jul | Aug | Sep | Oct | Nov | Dec | Q1 | Q2 | Q3 | Q4 | ||
| 2024 | -3.9% | +2.2% | -1.7% | +5.1% | +3.1% | +12.4% | -2.5% | -3.9% | +5.6% | +12.9% | +14.6% | ||||||
| 2025 | +2.8% | +1.4% | -0.7% | -0.9% | -2.2% | +4.4% | +7.1% | +1.5% | +5.1% | -0.5% | +7.5% | +2.5% | +3.5% | +1.1% | +14.3% | +9.6% | +31.1% |
| 2026 | +5.1% | +11.2% | -7.6% | +5.1% | +5.1% | +5.0% | +1.0% | +0.9% | -4.3% | +8.0% | +16.0% | -2.5% | +22.1% | ||||
Returns are time-weighted and compounded. The first and latest calendar periods may be partial.
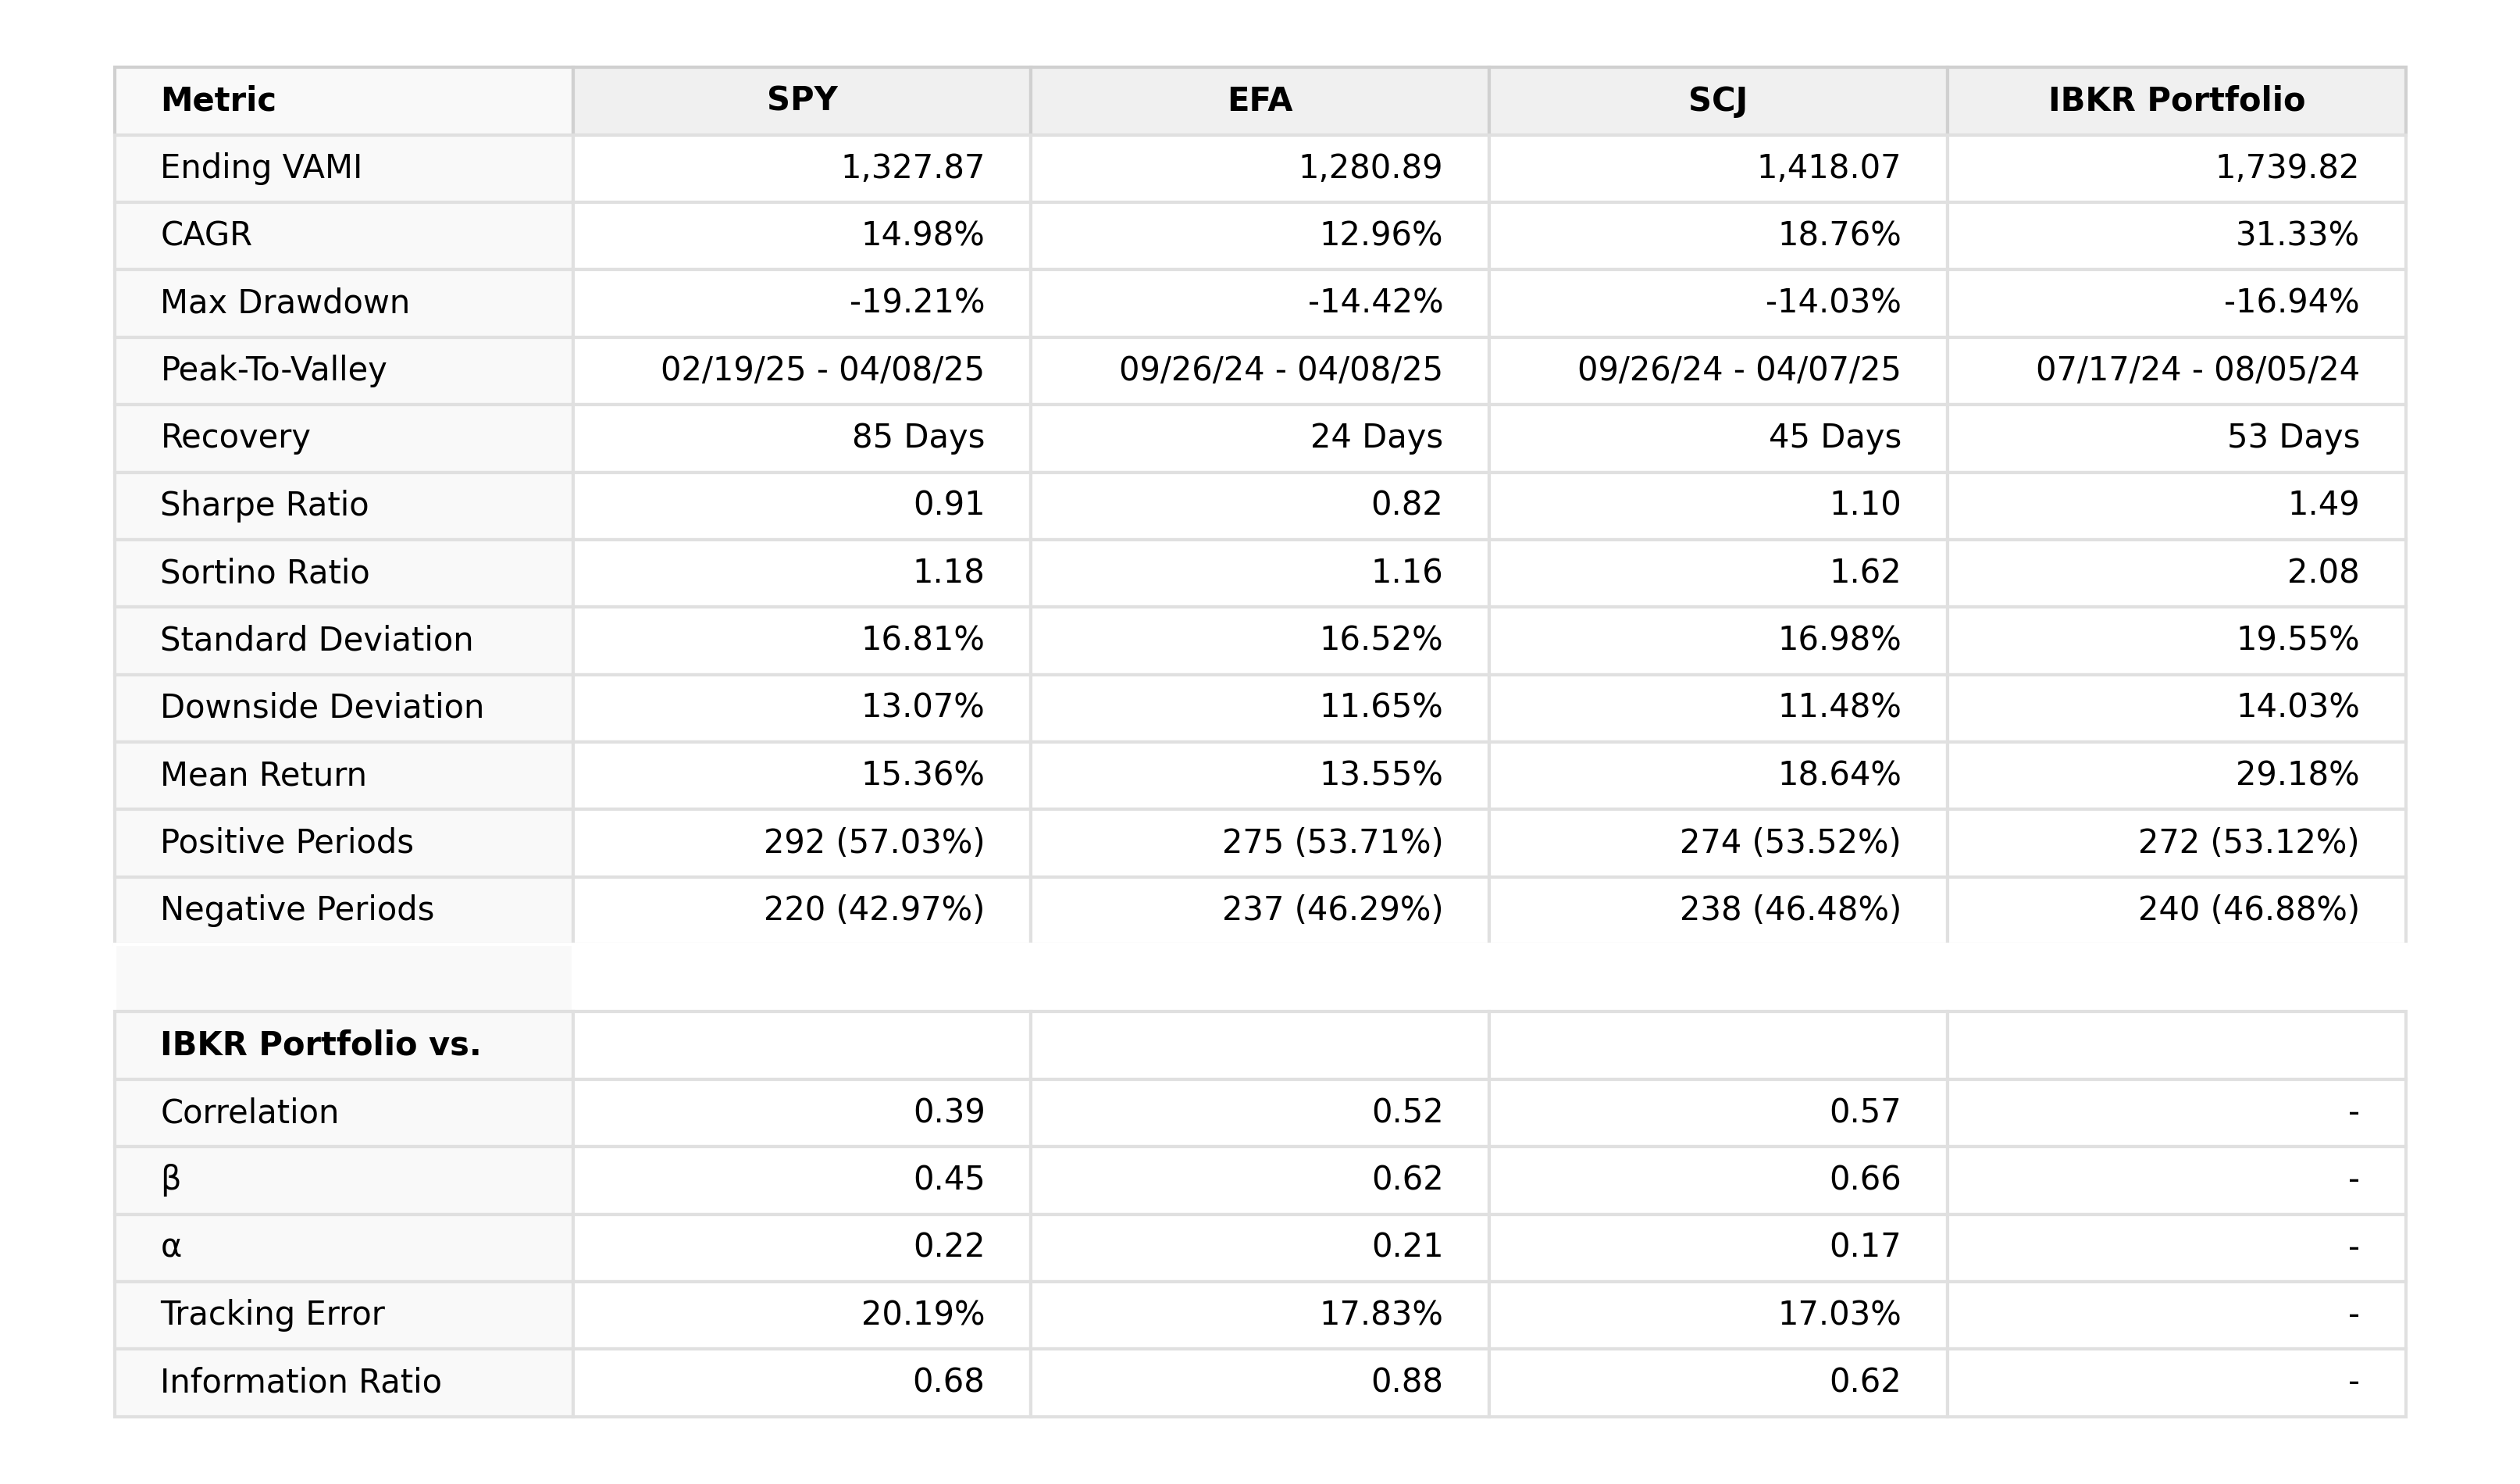
*Stats above use excess returns over Kenneth French's daily one-month Treasury bill RF series, followed by dividend-adjusted BIL returns after the latest French publication date.
Investment Themes
Fundamental Managers
Between ETFs, Mutual Funds, conglomerates, and people sharing their ideas online, there are many opportunities to ride the coat tails of talented fundamental managers for a reasonable cost.
Quant
Quants have developed a number of systematic strategies for harvesting alpha. Some of which are proprietary, many of which are well known. These alpha sources are a good form of diversification.
Concentrated Beta
The equity risk premium is by far the largest bet in most portfolios. There is merit in isolating the bet from the rest for the portfolio to the extent possible. This naturally reduces your beta in a full market meltdown.
- ONERX
- 2x Leveraged ETFs
- AI
Factor Bets
Trying to bet on winning factors before the bet becomes crowded.
- AVDV
- EM
- LatAm
- Korea
Diversifiers
Less correlated asset classes.
- Inflation Linked Assets (e.g. commodities)
- Catastrophe Bonds
- Bonds
- Crypto
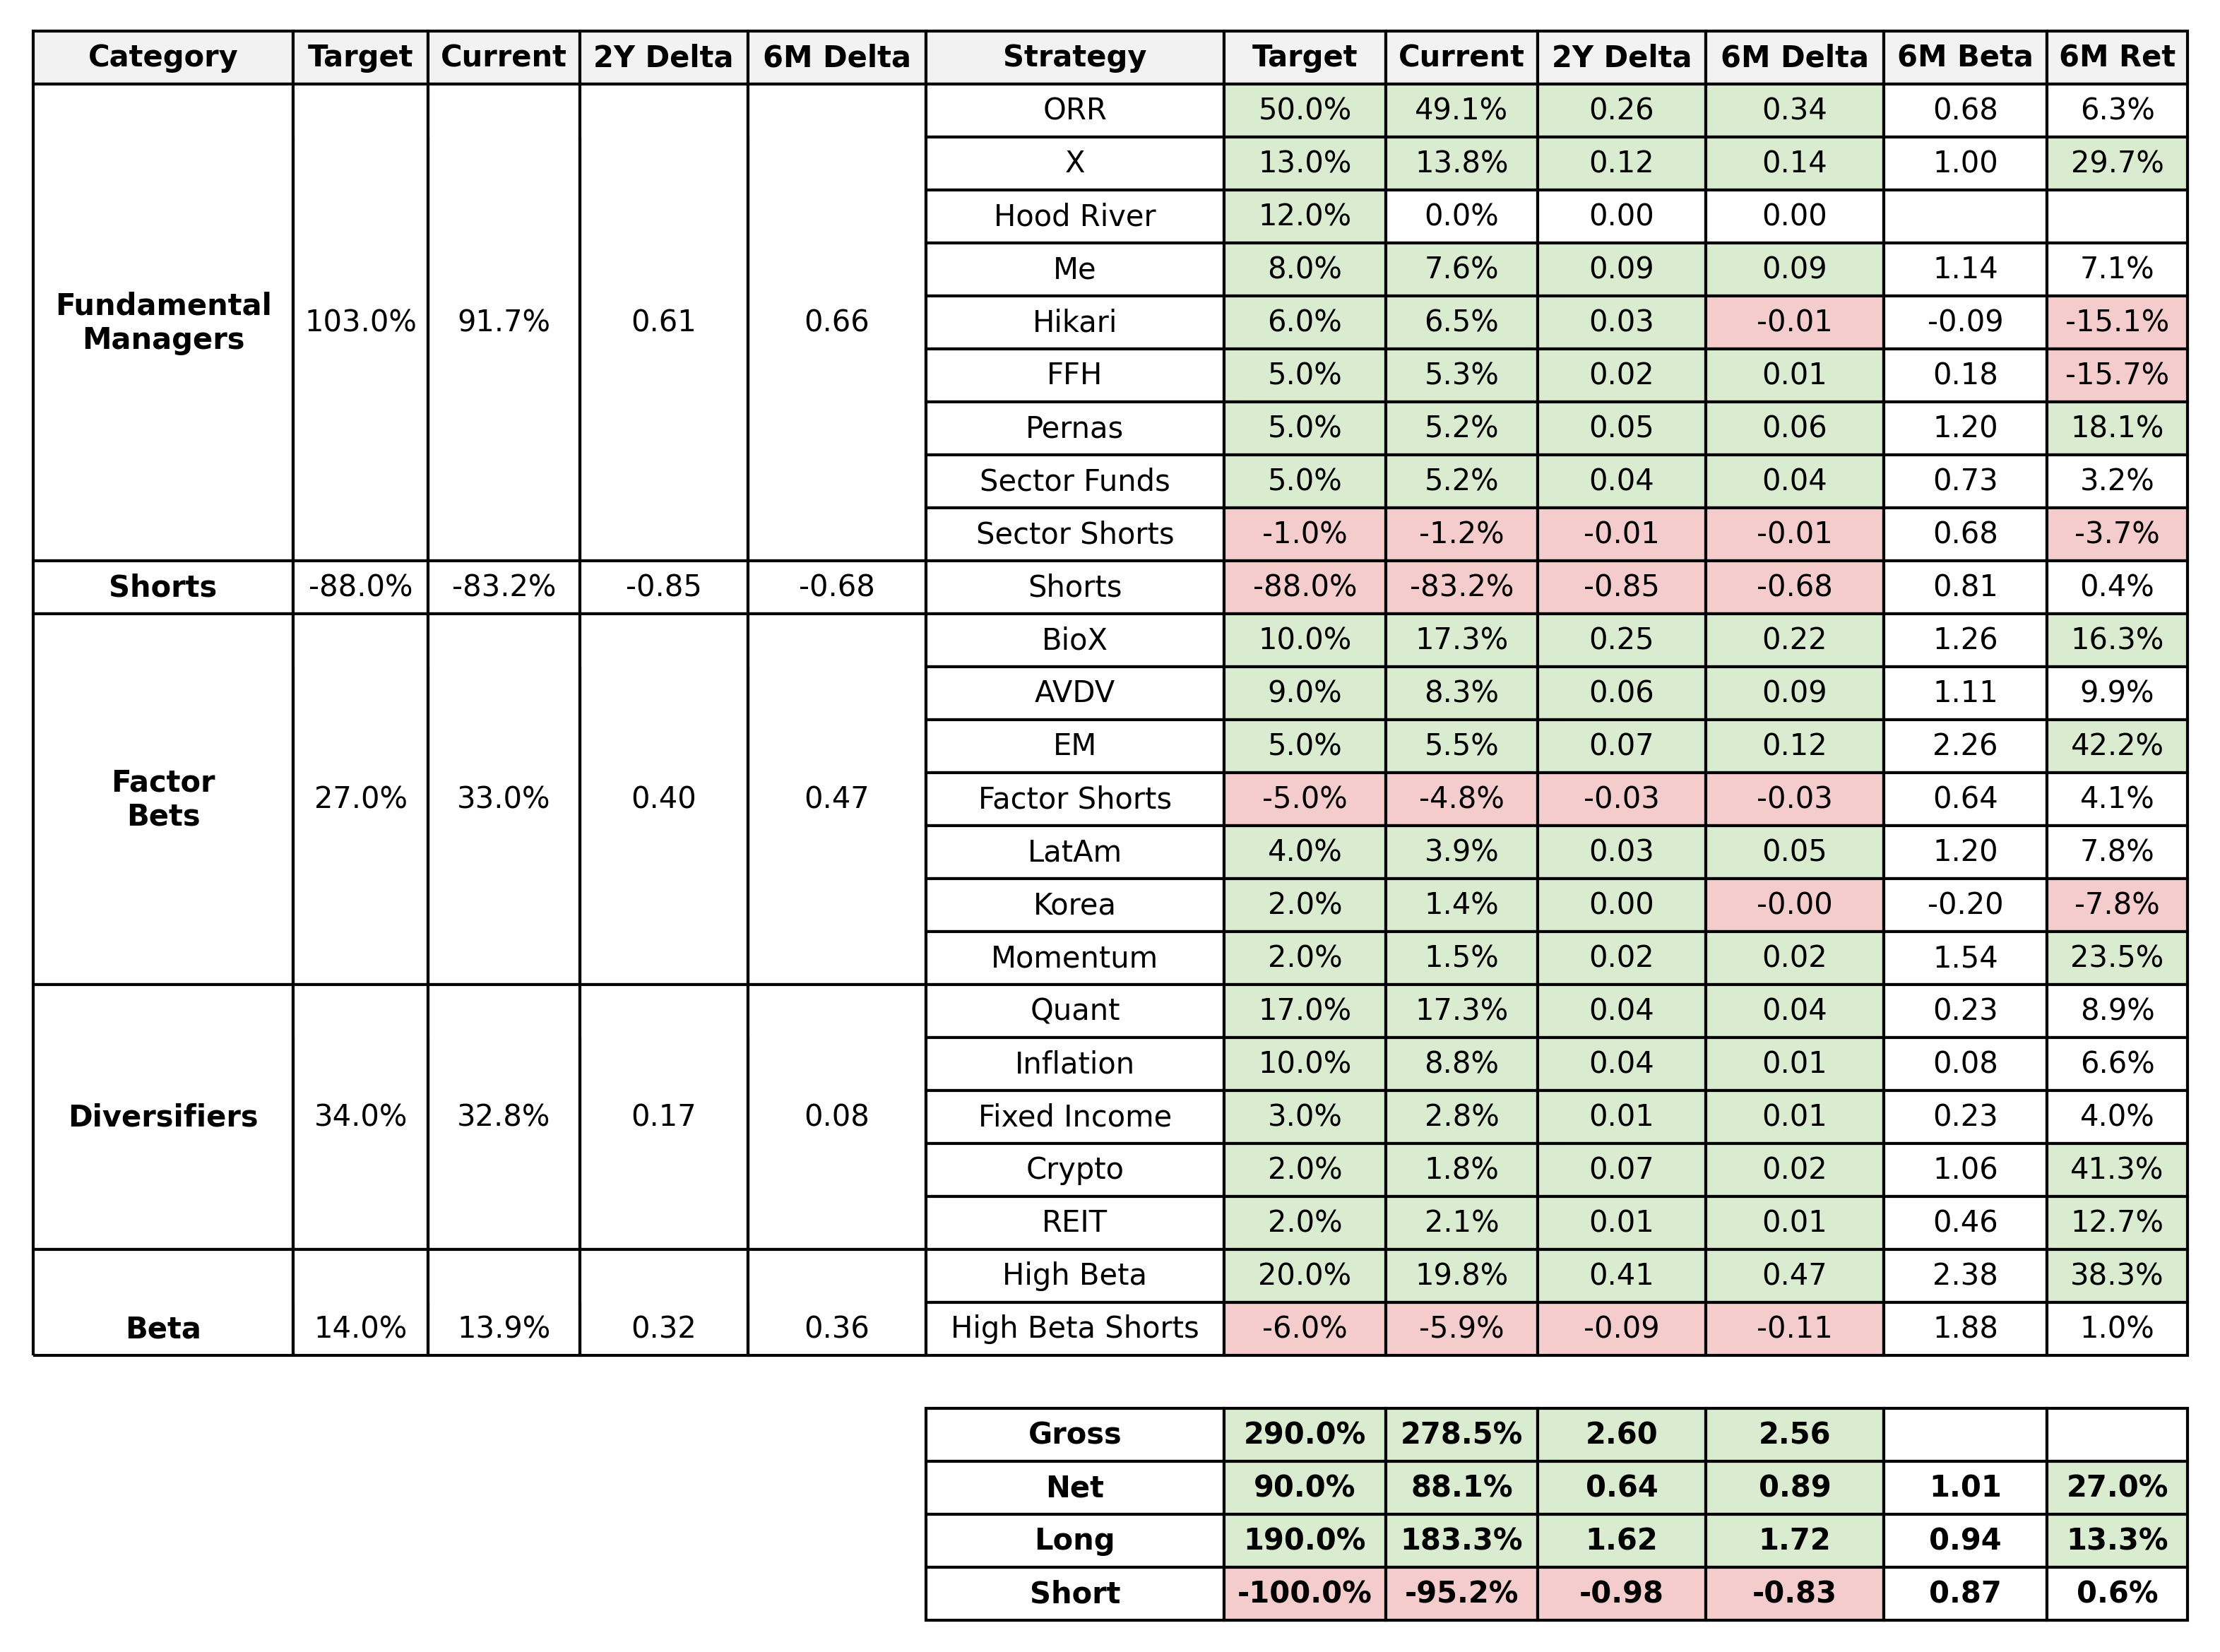
Current Portfolio
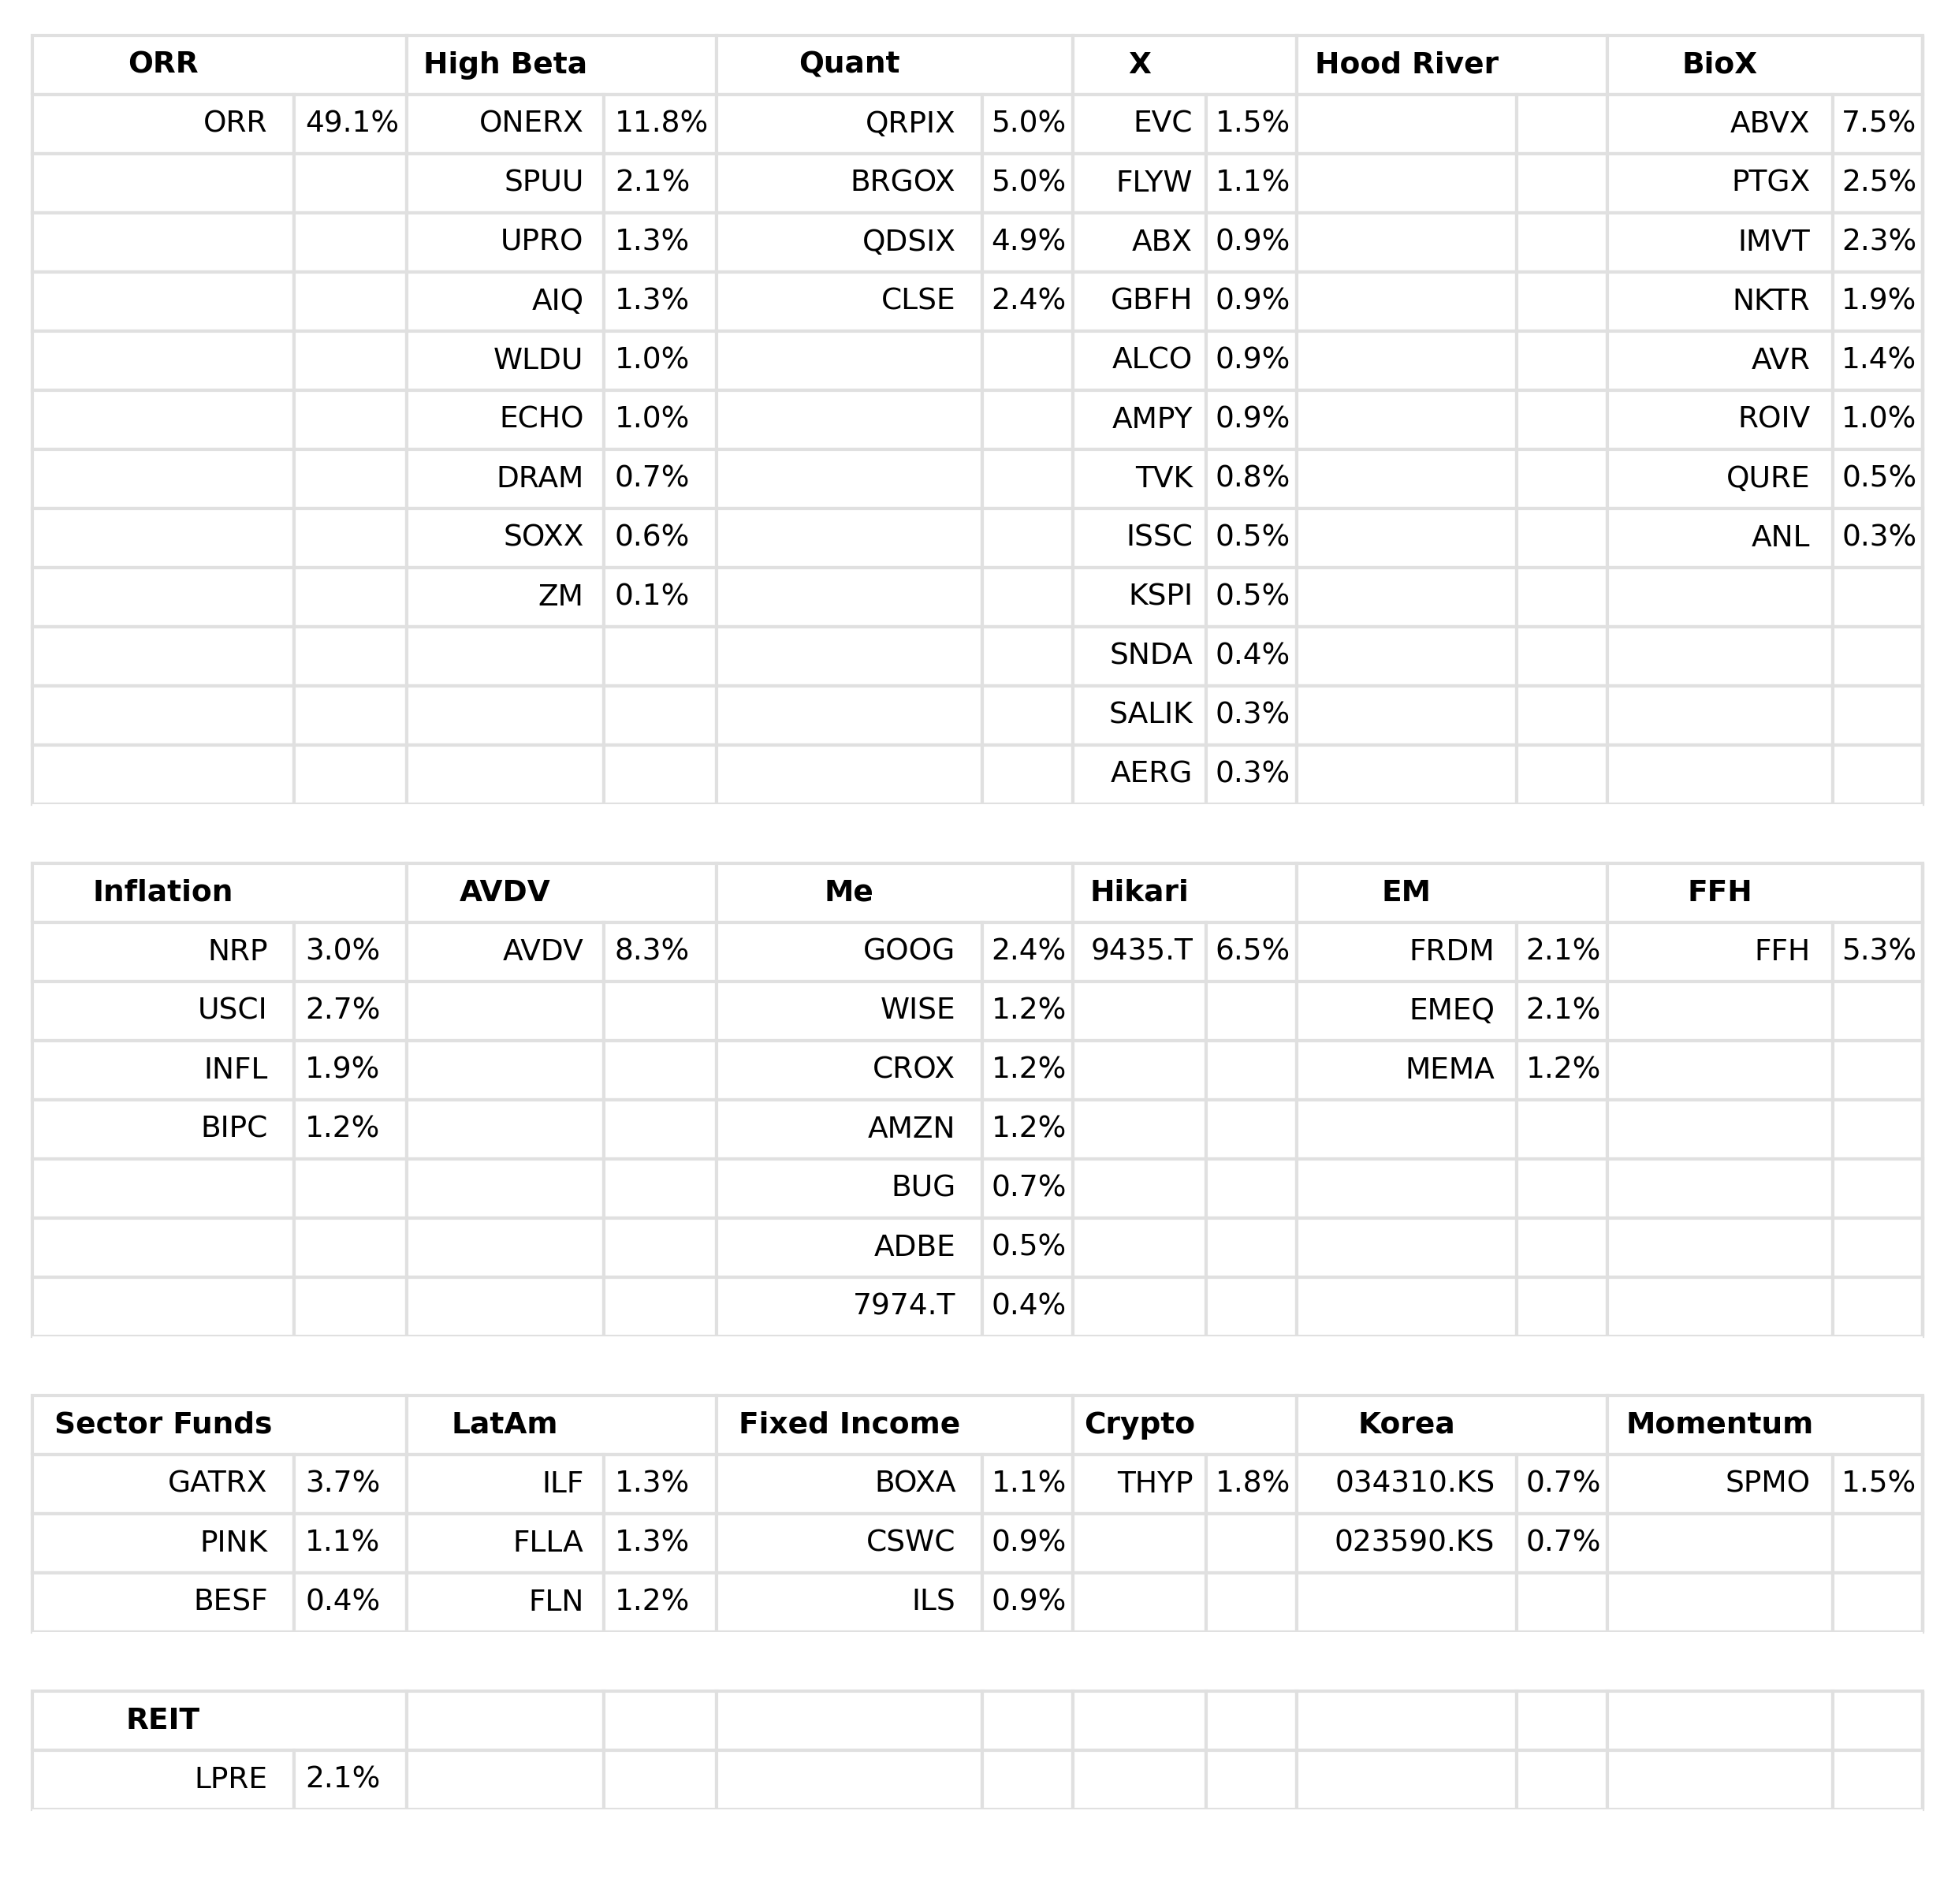
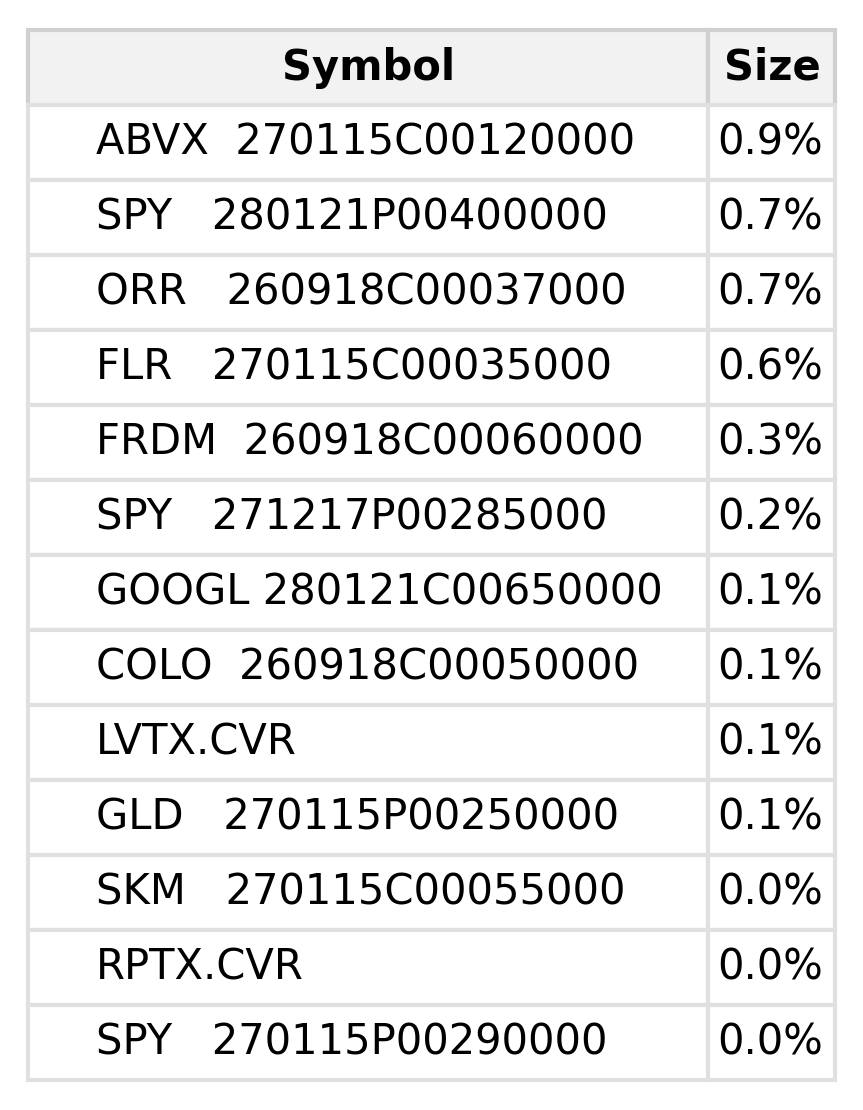
Individual Positions
Portfolio Returns Factor Breakdown
Historical factor contributions or average rolling-beta tilts relative to VT.
Experimental, informational analysis from FactorsToday; results may be incomplete or inaccurate and are not investment advice. Scope: IBKR time-weighted daily returns; Saturday and Sunday observations are compounded into Monday, and the first 252 trading days are used as model warm-up.
- Total return
- +62.31%
- Factor return
- +58.23%
- Annualized alpha
- +2.67%
- Rolling R²
- 28.9%
- Model
- Base + Sector + Industry
- Method
- 252-day LASSO
- Frequency
- Daily
- Observations
- 341
- Period
- –
- Benchmark
- VT
Portfolio Holdings Factor Breakdown
Return-implied factor exposure of today's fixed-weight holdings basket.
Experimental, informational analysis from FactorsToday; results may be incomplete or inaccurate and are not investment advice. The API receives one synthetic date/return stream and no constituent tickers, quantities, account identifiers, or NAV. Today's signed NAV weights are held constant on every modeled day. Actual adjusted-price returns are used once available; earlier returns use SPY return × the holding's current BSWA beta. This retrospective prehistory assumption uses future information and is not realized portfolio performance. Cash, options, CVRs, bonds, and other unsupported instruments contribute no modeled return. 12 modeled holding(s) are converted to USD with historical daily FX rates.
- Rolling R²
- 48.2%
- Model
- Base + Sector + Industry
- Method
- 252-day LASSO
- Benchmark
- VT
- Exposure date
- Simulation window
- –
All 152 eligible current stock/fund holdings were modeled locally; FactorsToday ticker coverage is not used.